Leading up to 2024, we collated and integrated global and regional indicators, focusing on:

Habitat extent

Ecological structure and function

Cumulative impacts
We have widespread global datasets that are updated monthly/annually.
Leading up to 2024, we collated and integrated global and regional indicators, focusing on:
We have widespread global datasets that are updated monthly/annually.

During 2025 we will be using automation to monitor locally relevant biodiversity indicators, via:


By 2026 we will have a publicly available dataset, accessible via desktop or mobile application. Our app will be quality assured where you can view:


Once the app is available for use, you can get involved and add your site to a growing database.
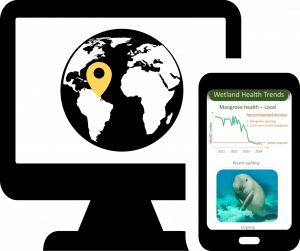
The integration of local wildlife trends with regional data about changes in habitat and threats increases the relevance and reliability of measures of wetland status and condition. Cost-effective automated monitoring of biodiversity indicators provides up-to-date, quality-assured data. Monitoring systems are deployed with local stewardship and indicator selection and provide compelling imagery and publicly accessible local data trends.
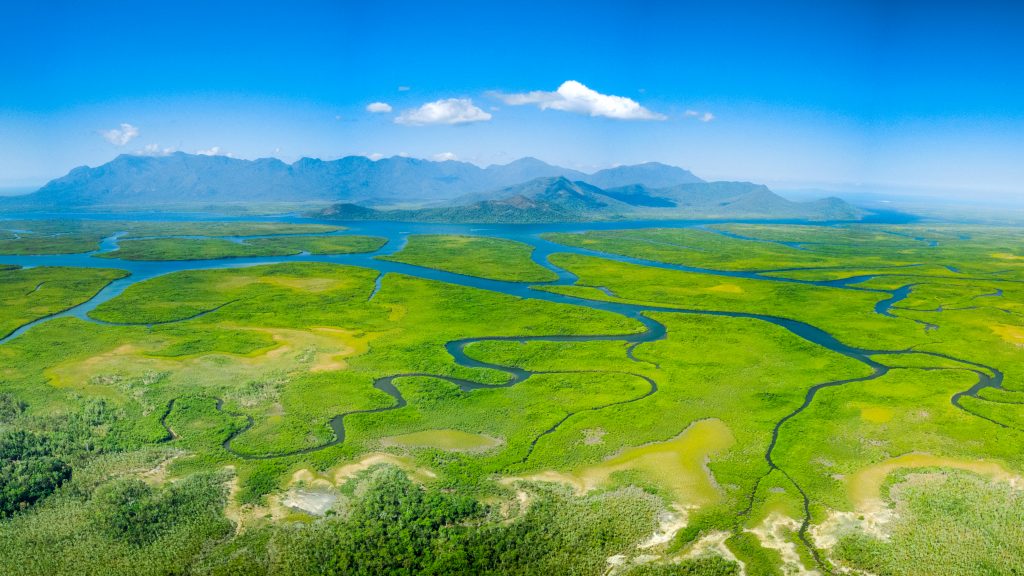
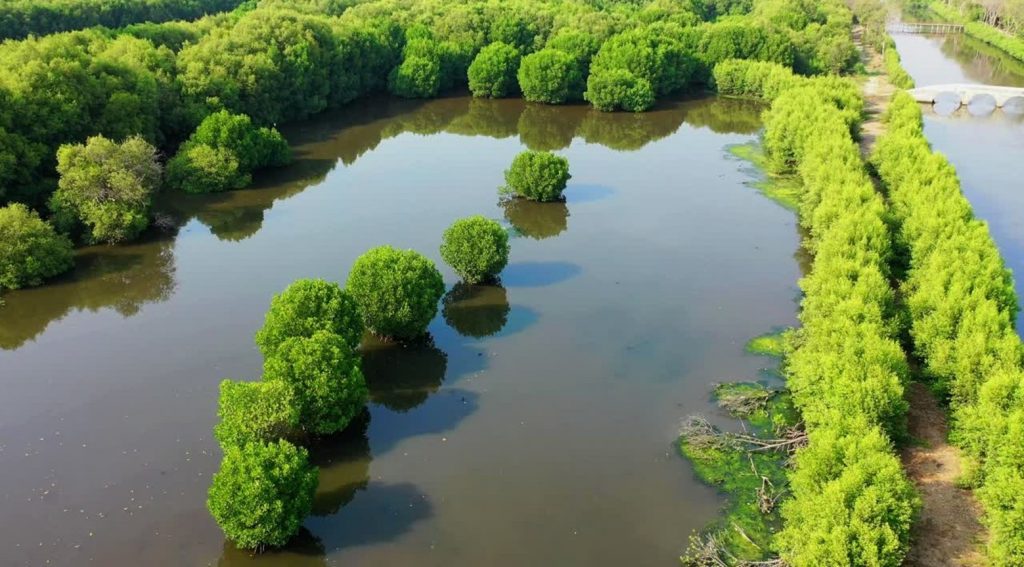
The primary focus and key outputs are for mangrove forests. Our scientists are mangrove experts. Many also have expertise on associated coastal habitats such as seagrass, saltmarsh, and shellfish reefs, which will be included where appropriate.
The monitoring, database and web-application will run long-term. Scientific, statistical and technological developments run through 2025 into 2026 at 20 locations. During 2026 additional locations will be added and from 2027 the program will be headquartered with a leading NGO with long-term oversight.
Indicators of biodiversity will be selected based on extensive local knowledge at each location, in conjunction with their sensitivity to change and cost-effectiveness. Indicators that represent the status of wildlife and ecosystem condition more generally are preferred (also see FAQ#6). Indicators can be for wildlife above (e.g. birds) and below (e.g. fish) water.
Data trends in local biodiversity indicators are used to ground-truth and fine-tune measures of wetland status and condition based on global measures of threats and habitat change. This leads to more precise estimates of wetland condition where local data are collected. Growth in the network of locations providing automated biodiversity data increases the robustness of the statistical framework. Local data can be used to identify patterns and relationships that with appropriate scaling can be extrapolated to broader spatial and temporal contexts.
The monitoring period needed to report reliable trends varies among indicators. We will keep this as short as possible by selecting indicators with high sensitivity to change and ability to respond to early warning signs, and for which existing data are available.
Research findings will be freely available to the public. Data summaries will be open access, and most raw data will be available after quality assurance under guidance of local partner obligations. Highlights of wildlife imagery will be available via the app.
Our big-data analytical framework is designed for up to hundreds of additional locations to be added. Trends in biodiversity indicators at additional locations will be integrated into the statistical fine-tuning of wetland status and condition measures.
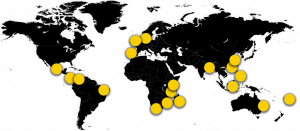
We use measures of threats and habitat change for all of the world’s mangrove forests. We will incorporate local biodiversity data collected automatically at 20 locations (in 18 countries) initially, with the potential for adding many additional locations in time.
The initial 20 locations were selected to demonstrate effectiveness of biodiversity monitoring in a diversity of cultural, climatic, geomorphic and threat settings. Additional locations will be added where there is strong local stewardship.
Yes. Our big-data analytical framework will allow for up to hundreds of additional locations in the second year of the program. Contact program administrators for advice about resource requirements and potential indicators.
For media inquiries and request for interviews please contact Professor Connolly (r.connolly@griffith.edu.au), or core partners under “About Us“.
Follow project updates, publications and visual materials via our website and via LinkedIn or subscribe to our newsletter.
Media are encouraged to refer to the program as: Automated biodiversity monitoring for coastal wetlands conservation action
Key phrase: Automated monitoring for wetland conservation
A list of research projects and opportunities will be available soon
The science and technology program is supported by partner institutions, government grants, and a private philanthropic foundation. We will sustain and expand the program through additional grants, collaborations, and partnerships with organizations that share our vision. If you or your organization are interested in supporting this initiative, we welcome discussions on potential funding opportunities (contact us page).